data/
  atus_00002.csv.gz
  atus_00002.txt
R/
  clean.R
load.RDeveloping a seamless, clean workflow for data analysis is harder than it sounds, especially because this is something that is almost never explicitly taught. Apparently we are all just supposed to “figure it out for ourselves”. For most of us, when we start our first few analysis projects, we basically have no idea how we are going to structure all of our files, or even what files we will need to make. As we try more and more things in our analysis (perhaps generating a large number of unnecessary files called analysis2.R, next-analysis.R, analysis-writeup.Rmd, data_clean.csv, regression_results.csv and data_all.csv along the way), we find that our project folder gets jumbled and confusing. The frustration when we come back to the project 6 months later and can’t remember which file contained the code that lead to the final conclusions is all too real.
This is why I have decided to describe in (possibly too much) detail the data cleaning workflow that I have somehow ended up with. I find this workflow to be particularly useful when dealing with messy (and possibly large) datasets that need several cleaning steps. Note that I did not develop this workflow in conjunction with any resources, I simply figured out what worked best for me via trial-and-error (a process which took 5 years and is definitely still ongoing). There will be several other resources out there on the internet describing “optimal workflows”, and these are definitely worth a read too (although a quick google found surprisingly few with the level of detail needed for a beginner). The key is figuring out a workflow that works best for you. That may be similar to mine, or it may not be.
If you decide to keep reading (perhaps because you too suffer from messy-project-syndrome and want some relief), by the end of this post you will know far too much about me and how I spend my time. As you will discover, I am particularly thorough when I clean data, and can spend hours simply making sure that I know what is in the data and moulding it so that it exactly adheres precisely to the format that I consider “clean”.
In this post I will describe my thought process as I download, clean and prepare for analysis the data from the 2016 American Time Use Survey (ATUS). I have written my process in sufficient detail such that you can follow along if you’d like to.
The American Time Use Survey is a yearly survey administered by the U.S. Census Bureau and sponsored by the Bureau of Labor Statistics. As with all surveys, it is probably good practice to first get an idea of what kind of population its respondents are supposed to represent. According to their website, the survey is sent to a randomly selected individual from each household in a set of eligible households chosen so as to represent a range of demographic characteristics. The set of eligible households consist of those who have completed their final month of the Current Population Survey (a monthly survey of households conducted by the Bureau of Census for the Bureau of Labor Statistics).
This survey data has been featured heavily on Nathan Yau’s blog, Flowing Data, which is where I became aware of it (thanks Nathan!).
Obtaining the data from the website
The ATUS data can be downloaded from the American Time Use Survey Extract Builder which is maintained by the Minnesota Population Center at the University of Minnesota.
To actually obtain the data, you need to click on “Build an Extract” in the left-hand “Data” menu item (or click on “Get Data” inside the “Create an Extract” box). While I was initially confused about what to do once I got to the page with the drop-down menus asking me to “Select Variables”, I decided to just go crazy and start clicking. I soon discovered that an “extract” refers to the subset of the data corresponding to whichever variables I like. Once inside each of these drop-down menu entries I needed to click on the yellow plus symbols under “cart” to add the variables to my extract.
After selecting the variables I wanted, I clicked on “Select Samples” and selected only the year 2016. I then went to my cart and clicked on “Create Data Extract” and I was taken to a page where I had to choose my data format. I changed the data format to .csv and submitted my extract by clicking on “Submit Extract”. Note that you need to create an account to download your selected data, but this only takes a second. Once your data has been created (they will email you when it is ready; this should only take about a minute), you can refresh the page and download the CSV data file!
It is also a good idea to download the basic codebook by right clicking on the link and selecting “Save Link As” (which will tell us what each of the variables mean). I saved the file as a .txt file rather than whatever .cbk (the default) is.
In case you’re interested, the variables I selected are listed at the end of this post.
Setting up the project directory
Now that I have successfully downloaded the data (a file called atus_00002.csv.gz), I am ready to set up my project directory. This involved a few quick steps.
I made a directory called
ATUS/. This is where my project is going to live.Within
ATUS/, I made two empty sub-directoriesR/anddata/In the
R/sub-directory I make two empty .R files calledload.Randclean.R.I then move the downloaded data and codebook files into
data/
If you’re following along, my working directory now looks like this:
It should be pretty obvious what load.R and clean.R are going to be for: they will be for loading the data and then cleaning the data (shocking, I know!).
While I will later start conducting my analysis in an eda.Rmd file, I usually don’t want to do the initial data cleaning in this file as it can be long and annoying to have to scroll past. Instead, I prefer to have separate scripts containing functions for loading and cleaning the data which I will later call in my eda.Rmd file.
Loading the data: load.R
Time to start work in the load.R file! The first thing I want to do is attempt to load in the data. Sometimes this is painless and easy, and sometimes this is a nightmare (prompting a session of frantic googling on how to load obscure data types into R).
The first lines of code I write in load.R is as follows:
# open zipped file for reading
unz <- gzfile("data/atus_00002.csv.gz")
# load in the data
time_use_orig <- read.csv(unz)
when I run it in the console, I am pleasantly surprised to find that it works without any issue.
I then take my first look at the data in the console using the dim() command to identify the dimension of the data and the head() command to view the first 6 rows.
dim(time_use_orig)[1] 10493 64head(time_use_orig) CASEID YEAR NUMCONTACTS_CPS8 HRHHID_CPS8 HRHHID2_CPS8 STATEFIP HH_SIZE
1 2.01601e+13 2016 1 3.509403e+14 3011 13 3
2 2.01601e+13 2016 1 2.025055e+14 3011 51 2
3 2.01601e+13 2016 2 1.243705e+14 3111 11 4
4 2.01601e+13 2016 1 2.041305e+14 3011 26 4
5 2.01601e+13 2016 1 2.203965e+13 3011 29 2
6 2.01601e+13 2016 0 1.021017e+13 3011 12 5
FAMINCOME HH_NUMKIDS HH_NUMADULTS PERNUM LINENO WT06 AGE SEX RACE HISPAN
1 3 0 3 1 1 24588650 62 2 100 100
2 6 0 2 1 1 5445941 69 1 110 100
3 4 2 2 1 1 8782622 24 2 110 100
4 8 3 1 1 1 3035910 31 2 100 100
5 13 0 2 1 1 6978586 59 2 100 100
6 5 4 1 1 1 5191610 16 2 120 244
ASIAN MARST AGE_CPS8 SEX_CPS8 EDUC EDUCYRS SCHLCOLL SCHLCOLL_CPS8 EMPSTAT
1 999 1 62 2 21 112 99 98 5
2 999 1 69 1 16 111 99 98 5
3 999 6 24 2 20 102 1 1 5
4 999 4 31 2 30 214 1 4 1
5 999 1 59 2 21 112 99 98 1
6 999 6 16 2 15 110 3 1 5
OCC2 OCC IND2 IND FULLPART UHRSWORKT UHRSWORK1 UHRSWORK2 EARNWEEK
1 9999 99999 9999 99999 99 9999 999 999 99999.99
2 9999 99999 9999 99999 99 9999 999 999 99999.99
3 9999 99999 9999 99999 99 9999 999 999 99999.99
4 130 3600 251 8180 2 32 32 999 469.44
5 125 2540 240 7860 2 12 6 6 302.50
6 9999 99999 9999 99999 99 9999 999 999 99999.99
PAIDHOUR EARNRPT HOURWAGE HRSATRATE OTUSUAL OTPAY UHRSWORKT_CPS8
1 99 99 999.99 999 99 99999.99 9999
2 99 99 999.99 999 99 99999.99 9999
3 99 99 999.99 999 99 99999.99 9999
4 1 1 14.67 32 0 99999.99 40
5 1 3 17.00 999 0 99999.99 55
6 99 99 999.99 999 99 99999.99 9999
UHRSWORK1_CPS8 UHRSWORK2_CPS8 HRSWORKT_CPS8 ACT_CAREHH ACT_CARENHH ACT_EDUC
1 999 999 9999 0 0 0
2 999 999 9999 0 0 0
3 999 999 9999 0 0 0
4 40 999 40 60 0 0
5 30 25 55 0 0 0
6 999 999 9999 0 0 0
ACT_FOOD ACT_GOVSERV ACT_HHACT ACT_HHSERV ACT_PCARE ACT_PHONE ACT_PROFSERV
1 40 0 190 0 715 0 0
2 30 0 230 0 620 0 0
3 75 0 105 0 1060 0 0
4 165 0 395 0 655 45 0
5 30 0 250 0 580 120 0
6 120 0 100 0 620 0 0
ACT_PURCH ACT_RELIG ACT_SOCIAL ACT_SPORTS ACT_TRAVEL ACT_VOL ACT_WORK
1 0 0 465 0 30 0 0
2 0 0 560 0 0 0 0
3 60 0 20 0 60 0 0
4 0 0 120 0 0 0 0
5 18 60 177 0 75 130 0
6 0 0 355 50 35 0 0
ERS_ASSOC ERS_PRIM
1 0 40
2 0 30
3 0 75
4 0 165
5 15 30
6 0 120It is pretty clear that everything is coded numerically and the variable names are fairly meaningless to a human. Fortunately, the codebook explains all. I spend some time browsing it.
The loadData() function
To make things simple in the long-run, I turn the above commands into a reusable function called loadData(). This function will have only one argument that specifies the path of the data in the local directory (relative to the load.R file). I usually set the default path to be the actual path for my setup.
# a function to load in the data
loadData <- function(path_to_data = "data/atus_00002.csv.gz") {
  # open zipped file for reading
  unz <- gzfile(path_to_data)
  # load in the data
  read.csv(unz)
}
To test my function, I simply run in my console by typing
time_use_orig <- loadData()and look at the output of head(time_use_orig).
Obviously such a function is a bit redundant in this setting: it is just as easy to write read.csv(gzfile("data/atus_00002.csv.gz")) in my eventual eda.Rmd file as it is to write loadData("data/atus_00002.csv.gz"). The reason I keep the load.R file in this case is because this is just my default workflow. I always load in my data using a function called loadData. In some situations, there are many, many things that need to be done in order to load the data, meaning that my loadData function can be fairly complicated. For example, sometimes column names need to be read in separately and then attached to the data, and sometimes I need to play with the format of the data to get R to play nice.
Cleaning the data: clean.R
Next, I need to make some decisions about whether to keep the data in its raw, ugly form, or to spend some time making my life easier in the long-run by converting the column names to human-readable versions and converting the numeric codes for each variable to text descriptive characters or factors.
I also need to ensure that missing values are coded as NAs and that the class of each variable is what I would expect. For example, when I looked at the head() of the data above, I noticed that the CASEID variable is printed as a numeric in scientific notation, which is not ideal. IDs should probably be factors or characters (I go back and forth a lot on which I prefer)!
In clean.R I start work on a function called cleanData(). Like loadData(), the function cleanData() is always a part of my workflow.
When I eventually start the eda.Rmd file, I will load and clean the data like this:
# define the loadData() function
source("load.R")
# define the cleanData() function
source("clean.R")

# load the raw data
time_use_orig <- loadData("data/atus_00002.csv.gz")
# clean the data
time_use <- cleanData(time_use_orig)
The cleanData() function
The cleanData() function will actually call three separate functions, each performing a single task. These functions are
renameColumns(): an optional part of my workflow that changes the column names of each of my columns so that I can actually understand what they mean.convertMissing(): a function which converts missing values toNAconvertClass: a function which sets factor variables to factors, sets character variables to characters, etc
Making columns human-readable: renameColumns()
I hate reading column names that are all-caps, use ridiculous abbreviations and generally don’t adhere to my definition of “aesthetically pleasing”. Thus, whenever possible, I tend to convert my column names to human-readable versions. This is fairly tedious whenever the data has more than around 10 variables or so, but the process itself of renaming the variables is a very effective way of ensuring that you have a good idea of which variables are even in the data.
A word of caution: it is extremely important to check that you have correctly renamed the variables, since it is very easy to assign the wrong name to a variable, resulting in misleading conclusions.
Obviously this step is not practical if you have more than 100 or so variables (although I once did it with a dataset that had around 300 variables!). In addition, if I will at some point need to present the data to people who are very familiar with the original variable names, I won’t do any renaming either.
In this case, however, I have no particular allegiance to the original variable names and I want to make it as clear as possible (to myself, at least) what they mean.
To change the variable names, the renameColumns() function will leverage the dplyr function, select(). Note that I also drop a few variables at this stage that I decided weren’t interesting.
library(dplyr)
renameColumns <- function(data) {
  data <- data %>% select(id = CASEID,
                          year = YEAR,
                          # number of attempted contacts
                          num_contacts = NUMCONTACTS_CPS8,
                          state = STATEFIP,
                          household_size = HH_SIZE,
                          family_income = FAMINCOME,
                          num_children = HH_NUMKIDS,
                          num_adults = HH_NUMADULTS,
                          age = AGE,
                          sex = SEX,
                          race = RACE,
                          marital_status = MARST,
                          education_level = EDUC,
                          education_years = EDUCYRS,
                          employment_status = EMPSTAT,
                          occupation_category = OCC2,
                          occupation_industry = IND2,
                          employed_full_time = FULLPART,
                          hours_usually_worked = UHRSWORKT,
                          weekly_earning = EARNWEEK,
                          paid_hourly = PAIDHOUR,
                          hourly_wage = HOURWAGE,
                          hours_worked_hourly_rate = HRSATRATE,
                          time_spent_caring_household = ACT_CAREHH,
                          time_spent_caring_non_household = ACT_CARENHH,
                          time_spent_education = ACT_EDUC,
                          time_spent_eating = ACT_FOOD,
                          time_spent_gov = ACT_GOVSERV,
                          time_spent_household_activities = ACT_HHACT,
                          time_spent_household_services = ACT_HHSERV,
                          time_spent_personal_care = ACT_PCARE,
                          time_spent_phone = ACT_PHONE,
                          time_spent_personal_care_services = ACT_PROFSERV,
                          time_spent_shopping = ACT_PURCH,
                          time_spent_religion = ACT_RELIG,
                          time_spent_leisure = ACT_SOCIAL,
                          time_spent_sports = ACT_SPORTS,
                          time_spent_travelling = ACT_TRAVEL,
                          time_spent_volunteer = ACT_VOL,
                          time_spent_working = ACT_WORK)
  return(data)
}
I then test the function out by writing
time_use <- renameColumns(time_use_orig)in the console, and looking at the output of head(time_use).
Now, I am fully aware that this function I have just written is not generalizable to alternate subsets of the data variables. This will be one of only two places where I will need to change things if I want to re-run the analysis on a different subset of variables (the second place will be when I explicitly convert numeric variables to their character counterparts). I’m facing a trade-off between generalizability of my pipeline and having human-readable data. If I were intending to repeat this analysis on different variables, I would either remove the part of the workflow where I rename the variables (as well as the part where I convert numeric variables to meaningful factors later on), or I would set the variable names as an argument in the renameColumns() function (but sadly, select() doesn’t play very nicely with variables read in as character strings, so I try to avoid this).
Recoding missing values as NA: convertMissing()
If you took a look at the codebook, you will have noticed that there are many different ways to say that data is missing. This can be very problematic.
The most common way to code missingness in this data is to code it as 99 999, 9999, etc (depending on whether the entries for the variable are two, three, four or more digit numbers, respectively). These entries are referred to in the codebook as NIU (Not in universe). Other types of missing values are recorded such as 996 corresponding to Refused, 997 corresponding to Don't know and 998 corresponding to Blank.
I now need to decide what to convert to NA, keeping in mind that I need to be particularly careful for the variables with many different types of missingness (such as people who refused to answer, didn’t know or simply left the entry blank). I decide to take a look to see how widespread these types of missingness are by running the following code in the console:
# identify how many times informative missingness occurs for each variable
informative_missing <- sapply(time_use,
                              function(x) sum(x %in% c(996, 997, 998)))
# print out only the non-zero values
informative_missing[informative_missing != 0]
weekly_earning hours_worked_hourly_rate time_spent_personal_care
1 12 1
time_spent_leisure time_spent_working
1 1 Since these types of missingness are extremely rare, I decide to simply lump them in with all of the other NA values.
Next, I want to identify which variables have missing values coded as a varying number of 9s. Since the missing values are always supposed to correspond to the maximum, I printed out the maximum of each variable.
# print out the maximum of each column
sapply(time_use, max)
id year
2.016121e+13 2.016000e+03
num_contacts state
8.000000e+00 5.600000e+01
household_size family_income
1.300000e+01 1.600000e+01
num_children num_adults
9.000000e+00 8.000000e+00
age sex
8.500000e+01 2.000000e+00
race marital_status
4.000000e+02 6.000000e+00
education_level education_years
4.300000e+01 3.210000e+02
employment_status occupation_category
5.000000e+00 9.999000e+03
occupation_industry employed_full_time
9.999000e+03 9.900000e+01
hours_usually_worked weekly_earning
9.999000e+03 9.999999e+04
paid_hourly hourly_wage
9.900000e+01 9.999900e+02
hours_worked_hourly_rate time_spent_caring_household
9.990000e+02 8.800000e+02
time_spent_caring_non_household time_spent_education
9.100000e+02 1.000000e+03
time_spent_eating time_spent_gov
6.350000e+02 4.700000e+02
time_spent_household_activities time_spent_household_services
1.184000e+03 4.500000e+02
time_spent_personal_care time_spent_phone
1.434000e+03 4.200000e+02
time_spent_personal_care_services time_spent_shopping
5.250000e+02 6.000000e+02
time_spent_religion time_spent_leisure
7.130000e+02 1.392000e+03
time_spent_sports time_spent_travelling
1.260000e+03 1.265000e+03
time_spent_volunteer time_spent_working
9.200000e+02 1.350000e+03 I notice here that there are several variables with missing values as their maxima such as occupation_industry with a maximum of 9999, and hourly_wage with a maximum of 999.99. Since I don’t really want to manually convert these missing values to NA, I decide to automate it using the mutate_if() function from the dplyr package. First I write a few helper functions in the clean.R file for calculating the maximum of a vector and for identifying specific values in a vector.
# Helper function for identifying missing values equal to 99, 999, etc
equalFun <- function(x, value) {
  x == value
}

# Helper function for identifying if the max of a variable is equal to 99, ...
maxFun <- function(x, value) {
  max(x, na.rm = T) == value
}
The first argument of mutate_if() is a function which returns a Boolean value specifying which columns to select. The second argument is wrapped in funs() and itself is a function which specifies what to do to each column. if_else(equalFun(., 99), NA_integer_, .) can be read aloud as “If the value is equal to 99, convert it to a NA of integer type, otherwise do nothing” (the . serves as a placeholder for the data, like x in function(x)).
convertMissing <- function(data) {
  # convert missing values to NA
  data <- data %>%
    # mutate all missing values coded as 99 to NA
    mutate_if(function(x) maxFun(x, 99),
              funs(if_else(equalFun(., 99), NA_integer_, .))) %>%
    # mutate all missing values coded as 999 to NA
    mutate_if(function(x) maxFun(x, 999),
              funs(if_else(equalFun(., 999), NA_integer_, .))) %>%
    # mutate all missing values coded as 9999 to NA
    mutate_if(function(x) maxFun(x, 9999),
              funs(if_else(equalFun(., 9999), NA_integer_, .))) %>%
    # mutate all missing values coded as 999.99 to NA
    mutate_if(function(x) maxFun(x, 999.99),
              funs(if_else(equalFun(., 999.99), NA_real_, .))) %>%
    # mutate all missing values coded as 99999.99 to NA
    mutate_if(function(x) maxFun(x, 99999.99),
              funs(if_else(equalFun(., 99999.99), NA_real_, .))) %>%
    # mutate all missing values coded as 998 to NA
    mutate_if(function(x) maxFun(x, 998),
              funs(if_else(equalFun(., 998), NA_integer_, .))) %>%
    # mutate all missing values coded as 997 to NA
    mutate_if(function(x) maxFun(x, 997),
              funs(if_else(equalFun(., 997), NA_integer_, .)))
  return(data)
}
It took some playing around with running the body of the function in the console (with data defined as time_use) to get it to run without errors (I was getting errors to do with NA values and realized that I needed to add na.rm = T in the maxFun() function).
Once the body runs in the console, I then check to make sure that the complete function worked as expected by running it in the console and checking out the summary of the output.
# convert the missing values to NAs
time_use <- convertMissing(time_use)
Warning: `funs()` was deprecated in dplyr 0.8.0.
ℹ Please use a list of either functions or lambdas:
# Simple named list: list(mean = mean, median = median)
# Auto named with `tibble::lst()`: tibble::lst(mean, median)
# Using lambdas list(~ mean(., trim = .2), ~ median(., na.rm = TRUE))Warning: `funs()` was deprecated in dplyr 0.8.0.
ℹ Please use a list of either functions or lambdas:
# Simple named list: list(mean = mean, median = median)
# Auto named with `tibble::lst()`: tibble::lst(mean, median)
# Using lambdas list(~ mean(., trim = .2), ~ median(., na.rm = TRUE))Warning: `funs()` was deprecated in dplyr 0.8.0.
ℹ Please use a list of either functions or lambdas:
# Simple named list: list(mean = mean, median = median)
# Auto named with `tibble::lst()`: tibble::lst(mean, median)
# Using lambdas list(~ mean(., trim = .2), ~ median(., na.rm = TRUE))Warning: `funs()` was deprecated in dplyr 0.8.0.
ℹ Please use a list of either functions or lambdas:
# Simple named list: list(mean = mean, median = median)
# Auto named with `tibble::lst()`: tibble::lst(mean, median)
# Using lambdas list(~ mean(., trim = .2), ~ median(., na.rm = TRUE))Warning: `funs()` was deprecated in dplyr 0.8.0.
ℹ Please use a list of either functions or lambdas:
# Simple named list: list(mean = mean, median = median)
# Auto named with `tibble::lst()`: tibble::lst(mean, median)
# Using lambdas list(~ mean(., trim = .2), ~ median(., na.rm = TRUE))Warning: `funs()` was deprecated in dplyr 0.8.0.
ℹ Please use a list of either functions or lambdas:
# Simple named list: list(mean = mean, median = median)
# Auto named with `tibble::lst()`: tibble::lst(mean, median)
# Using lambdas list(~ mean(., trim = .2), ~ median(., na.rm = TRUE))Warning: `funs()` was deprecated in dplyr 0.8.0.
ℹ Please use a list of either functions or lambdas:
# Simple named list: list(mean = mean, median = median)
# Auto named with `tibble::lst()`: tibble::lst(mean, median)
# Using lambdas list(~ mean(., trim = .2), ~ median(., na.rm = TRUE))# check out the summary
summary(time_use) id year num_contacts state
Min. :2.016e+13 Min. :2016 Min. :0.0000 Min. : 1.00
1st Qu.:2.016e+13 1st Qu.:2016 1st Qu.:0.0000 1st Qu.:13.00
Median :2.016e+13 Median :2016 Median :0.0000 Median :27.00
Mean :2.016e+13 Mean :2016 Mean :0.2574 Mean :27.96
3rd Qu.:2.016e+13 3rd Qu.:2016 3rd Qu.:0.0000 3rd Qu.:42.00
Max. :2.016e+13 Max. :2016 Max. :8.0000 Max. :56.00
household_size family_income num_children num_adults
Min. : 1.000 Min. : 1.00 Min. :0.0000 Min. :1.000
1st Qu.: 1.000 1st Qu.: 8.00 1st Qu.:0.0000 1st Qu.:1.000
Median : 2.000 Median :12.00 Median :0.0000 Median :2.000
Mean : 2.657 Mean :10.85 Mean :0.7706 Mean :1.868
3rd Qu.: 4.000 3rd Qu.:14.00 3rd Qu.:1.0000 3rd Qu.:2.000
Max. :13.000 Max. :16.00 Max. :9.0000 Max. :8.000
age sex race marital_status
Min. :15.00 Min. :1.000 Min. :100.0 Min. :1.000
1st Qu.:35.00 1st Qu.:1.000 1st Qu.:100.0 1st Qu.:1.000
Median :49.00 Median :2.000 Median :100.0 Median :3.000
Mean :49.42 Mean :1.555 Mean :104.5 Mean :3.022
3rd Qu.:64.00 3rd Qu.:2.000 3rd Qu.:100.0 3rd Qu.:6.000
Max. :85.00 Max. :2.000 Max. :400.0 Max. :6.000
education_level education_years employment_status occupation_category
Min. :10.00 Min. :101.0 Min. :1.000 Min. :110.0
1st Qu.:21.00 1st Qu.:112.0 1st Qu.:1.000 1st Qu.:122.0
Median :30.00 Median :214.0 Median :1.000 Median :131.0
Mean :29.74 Mean :187.8 Mean :2.559 Mean :138.1
3rd Qu.:40.00 3rd Qu.:217.0 3rd Qu.:5.000 3rd Qu.:150.0
Max. :43.00 Max. :321.0 Max. :5.000 Max. :200.0
NA's :4119
occupation_industry employed_full_time hours_usually_worked weekly_earning
Min. :100.0 Min. :1.000 Min. : 0.0 Min. : 0.0
1st Qu.:160.0 1st Qu.:1.000 1st Qu.: 38.0 1st Qu.: 458.8
Median :220.0 Median :1.000 Median : 40.0 Median : 800.0
Mean :210.4 Mean :1.219 Mean : 672.6 Mean : 994.0
3rd Qu.:251.0 3rd Qu.:1.000 3rd Qu.: 50.0 3rd Qu.:1346.2
Max. :300.0 Max. :2.000 Max. :9995.0 Max. :2884.6
NA's :4119 NA's :4119 NA's :4119 NA's :4833
paid_hourly hourly_wage hours_worked_hourly_rate
Min. :1.000 Min. : 0.00 Min. : 1.00
1st Qu.:1.000 1st Qu.:10.50 1st Qu.:28.00
Median :1.000 Median :15.00 Median :40.00
Mean :1.444 Mean :18.34 Mean :33.86
3rd Qu.:2.000 3rd Qu.:22.00 3rd Qu.:40.00
Max. :2.000 Max. :99.99 Max. :90.00
NA's :4833 NA's :7348 NA's :8438
time_spent_caring_household time_spent_caring_non_household
Min. : 0.00 Min. : 0.000
1st Qu.: 0.00 1st Qu.: 0.000
Median : 0.00 Median : 0.000
Mean : 31.85 Mean : 8.603
3rd Qu.: 11.00 3rd Qu.: 0.000
Max. :880.00 Max. :910.000
time_spent_education time_spent_eating time_spent_gov
Min. : 0.00 Min. : 0.00 Min. : 0.0000
1st Qu.: 0.00 1st Qu.: 30.00 1st Qu.: 0.0000
Median : 0.00 Median : 60.00 Median : 0.0000
Mean : 15.39 Mean : 64.99 Mean : 0.3647
3rd Qu.: 0.00 3rd Qu.: 90.00 3rd Qu.: 0.0000
Max. :1000.00 Max. :635.00 Max. :470.0000
time_spent_household_activities time_spent_household_services
Min. : 0.0 Min. : 0.0000
1st Qu.: 15.0 1st Qu.: 0.0000
Median : 75.0 Median : 0.0000
Mean : 121.1 Mean : 0.9868
3rd Qu.: 180.0 3rd Qu.: 0.0000
Max. :1184.0 Max. :450.0000
time_spent_personal_care time_spent_phone time_spent_personal_care_services
Min. : 0.0 Min. : 0.000 Min. : 0.000
1st Qu.: 495.0 1st Qu.: 0.000 1st Qu.: 0.000
Median : 570.0 Median : 0.000 Median : 0.000
Mean : 580.3 Mean : 6.774 Mean : 4.747
3rd Qu.: 660.0 3rd Qu.: 0.000 3rd Qu.: 0.000
Max. :1434.0 Max. :420.000 Max. :525.000
time_spent_shopping time_spent_religion time_spent_leisure time_spent_sports
Min. : 0.00 Min. : 0.0 Min. : 0.0 Min. : 0.00
1st Qu.: 0.00 1st Qu.: 0.0 1st Qu.: 130.0 1st Qu.: 0.00
Median : 0.00 Median : 0.0 Median : 260.0 Median : 0.00
Mean : 24.15 Mean : 13.4 Mean : 298.4 Mean : 20.22
3rd Qu.: 30.00 3rd Qu.: 0.0 3rd Qu.: 432.0 3rd Qu.: 0.00
Max. :600.00 Max. :713.0 Max. :1392.0 Max. :1260.00
time_spent_travelling time_spent_volunteer time_spent_working
Min. : 0.0 Min. : 0.000 Min. : 0.0
1st Qu.: 20.0 1st Qu.: 0.000 1st Qu.: 0.0
Median : 55.0 Median : 0.000 Median : 0.0
Mean : 71.5 Mean : 8.469 Mean : 157.7
3rd Qu.: 95.0 3rd Qu.: 0.000 3rd Qu.: 375.0
Max. :1265.0 Max. :920.000 Max. :1350.0
Scrolling through the summary, I notice a few peculiarities. In particular, there are several variables that have stupidly large values. For example the maximum value for hours_usually_worked is 9995 (this didn’t appear in the codebook!). I decided to look at a histogram of this variable to see how typical this value is. I ran the following code in the console:
library(ggplot2)
ggplot(time_use) + geom_histogram(aes(x = hours_usually_worked))
`stat_bin()` using `bins = 30`. Pick better value with `binwidth`.Warning: Removed 4119 rows containing non-finite values (`stat_bin()`).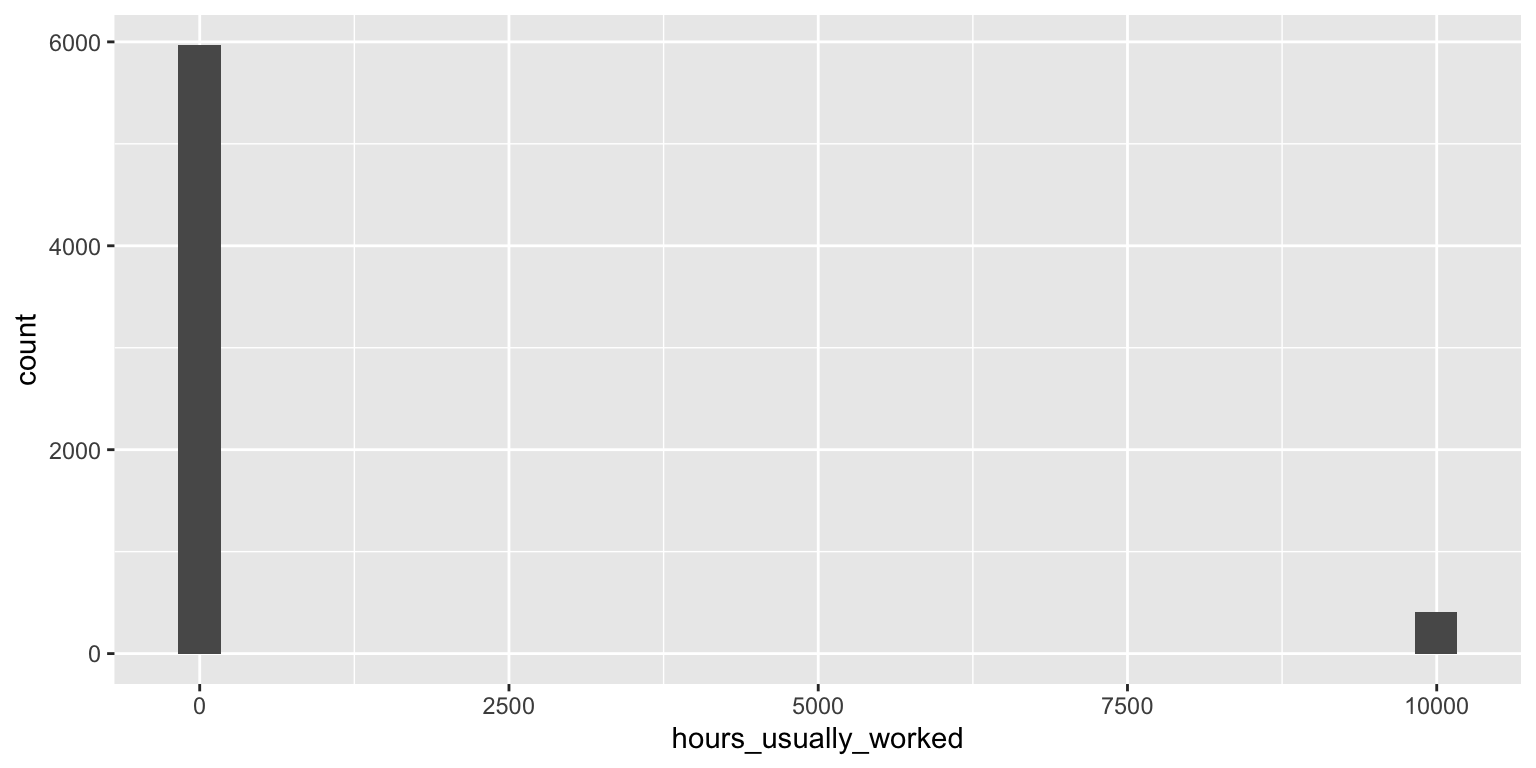
From the histogram, it is fairly clear that there is an additional type of missing value (405 samples have a value of 9995) that was not mentioned in the documentation. I then go back and update my convertMissing() function to include this extra missing value.
convertMissing <- function(data) {
  # convert missing values to NA
  data <- data %>%
    # mutate all missing values coded as 99 to NA
    mutate_if(function(x) maxFun(x, 99),
              funs(if_else(equalFun(., 99), NA_integer_, .))) %>%
    # mutate all missing values coded as 999 to NA
    mutate_if(function(x) maxFun(x, 999),
              funs(if_else(equalFun(., 999), NA_integer_, .))) %>%
    # mutate all missing values coded as 9999 to NA
    mutate_if(function(x) maxFun(x, 9999),
              funs(if_else(equalFun(., 9999), NA_integer_, .))) %>%
    # mutate all missing values coded as 999.99 to NA
    mutate_if(function(x) maxFun(x, 999.99),
              funs(if_else(equalFun(., 999.99), NA_real_, .))) %>%
    # mutate all missing values coded as 99999.99 to NA
    mutate_if(function(x) maxFun(x, 99999.99),
              funs(if_else(equalFun(., 99999.99), NA_real_, .))) %>%
    # mutate all missing values coded as 998 to NA
    mutate_if(function(x) maxFun(x, 998),
              funs(if_else(equalFun(., 998), NA_integer_, .))) %>%
    # mutate all missing values coded as 997 to NA
    mutate_if(function(x) maxFun(x, 997),
              funs(if_else(equalFun(., 997), NA_integer_, .))) %>%
    # mutate all missing values coded as 9995 to NA
    mutate_if(function(x) maxFun(x, 9995),
              funs(if_else(equalFun(., 9995), NA_integer_, .)))
  return(data)
}
Next, I ran the convertMissing() function again the data and re-made the histogram to make sure that everything was going smoothly.
# re-run the renameColumns() function
time_use <- renameColumns(time_use_orig)
# convert missing values to NA
time_use <- convertMissing(time_use)
Warning: `funs()` was deprecated in dplyr 0.8.0.
ℹ Please use a list of either functions or lambdas:
# Simple named list: list(mean = mean, median = median)
# Auto named with `tibble::lst()`: tibble::lst(mean, median)
# Using lambdas list(~ mean(., trim = .2), ~ median(., na.rm = TRUE))Warning: `funs()` was deprecated in dplyr 0.8.0.
ℹ Please use a list of either functions or lambdas:
# Simple named list: list(mean = mean, median = median)
# Auto named with `tibble::lst()`: tibble::lst(mean, median)
# Using lambdas list(~ mean(., trim = .2), ~ median(., na.rm = TRUE))Warning: `funs()` was deprecated in dplyr 0.8.0.
ℹ Please use a list of either functions or lambdas:
# Simple named list: list(mean = mean, median = median)
# Auto named with `tibble::lst()`: tibble::lst(mean, median)
# Using lambdas list(~ mean(., trim = .2), ~ median(., na.rm = TRUE))Warning: `funs()` was deprecated in dplyr 0.8.0.
ℹ Please use a list of either functions or lambdas:
# Simple named list: list(mean = mean, median = median)
# Auto named with `tibble::lst()`: tibble::lst(mean, median)
# Using lambdas list(~ mean(., trim = .2), ~ median(., na.rm = TRUE))Warning: `funs()` was deprecated in dplyr 0.8.0.
ℹ Please use a list of either functions or lambdas:
# Simple named list: list(mean = mean, median = median)
# Auto named with `tibble::lst()`: tibble::lst(mean, median)
# Using lambdas list(~ mean(., trim = .2), ~ median(., na.rm = TRUE))Warning: `funs()` was deprecated in dplyr 0.8.0.
ℹ Please use a list of either functions or lambdas:
# Simple named list: list(mean = mean, median = median)
# Auto named with `tibble::lst()`: tibble::lst(mean, median)
# Using lambdas list(~ mean(., trim = .2), ~ median(., na.rm = TRUE))Warning: `funs()` was deprecated in dplyr 0.8.0.
ℹ Please use a list of either functions or lambdas:
# Simple named list: list(mean = mean, median = median)
# Auto named with `tibble::lst()`: tibble::lst(mean, median)
# Using lambdas list(~ mean(., trim = .2), ~ median(., na.rm = TRUE))Warning: `funs()` was deprecated in dplyr 0.8.0.
ℹ Please use a list of either functions or lambdas:
# Simple named list: list(mean = mean, median = median)
# Auto named with `tibble::lst()`: tibble::lst(mean, median)
# Using lambdas list(~ mean(., trim = .2), ~ median(., na.rm = TRUE))# re-make the histogram
ggplot(time_use) + geom_histogram(aes(x = hours_usually_worked))`stat_bin()` using `bins = 30`. Pick better value with `binwidth`.Warning: Removed 4524 rows containing non-finite values (`stat_bin()`).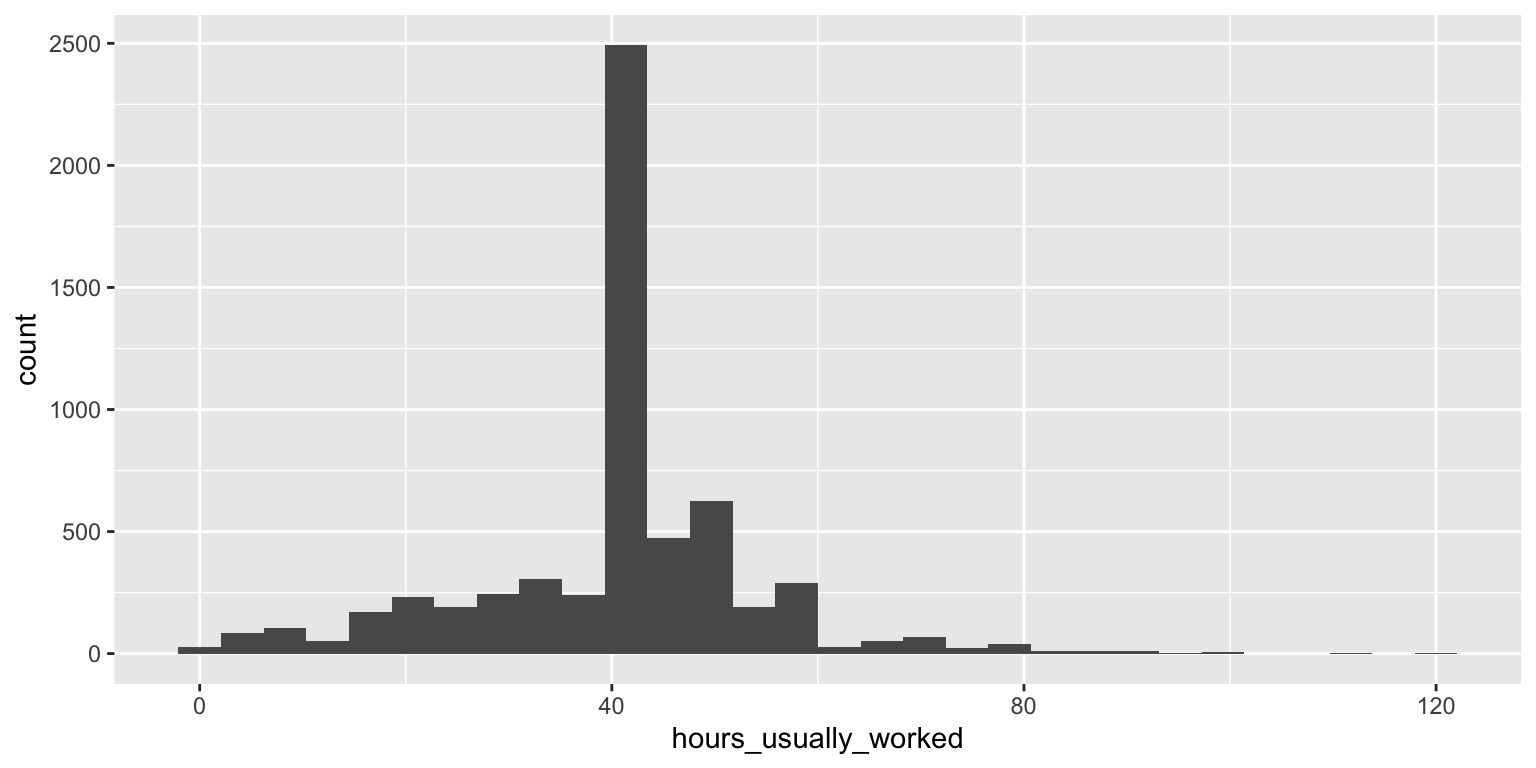
Now that that was sorted out, it occurred to me that I wasn’t sure what kind of scale the time_spent variables were on (is it hours spent in the last week? In the last month? The last year? Perhaps it is minutes spent over the last day? It probably should have occurred to me to ask this earlier, but it didn’t. Whatever… I’m asking it now! After spending some time perusing the internet for a while, I found this table which summarised the average hours spend per day on a range of activities. For example, it said that on average, people spend 9.58 hours per day on “personal care activities”. The histogram below shows the distribution of values for the time_spent_personal_care.
ggplot(time_use) + geom_histogram(aes(x = time_spent_personal_care))`stat_bin()` using `bins = 30`. Pick better value with `binwidth`.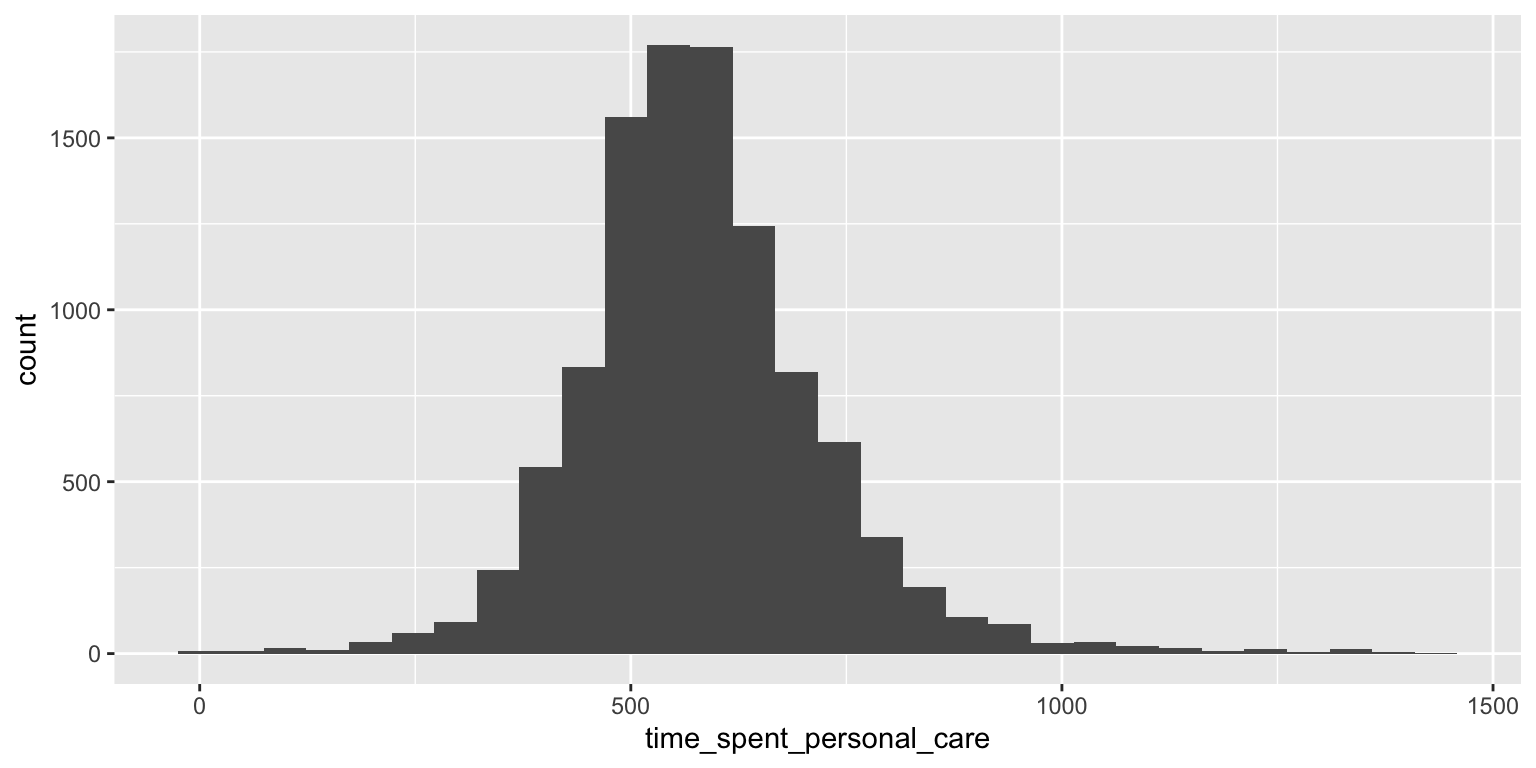
The mean value in the data is 580, which when divided by 60 gives 9.6. From this “evidence” I conclude that what the data contains is the number of minutes spent per day. Whether this is averaged over a week, or is based on one particular day, I honestly don’t know. But for my purposes, I’ll just take each value as the number of minutes spent on the activity on a “typical” day.
Ensuring each variable has the correct class: convertClass()
The final cleaning task involves converting categorical values to have a categorical variable class (such as a factor), and other things along these lines involving variable classes.
Recall that the person ID variable, CASEID, is currently coded as a numeric (which is printed in scientific notation). In general, it is good practice to code IDs as factors (or characters).
There are also many other variables that should be coded as factors: state, sex, race, marital_status, education_level, family_income, employment_status, occupation_category, and occupation_industry.
Now begins the part of my cleaning process that often takes the longest: I am going to convert each of these numeric variables not only to factors, but to meaningful factors. I don’t want to make plots for genders 1 and 2, or for states 42 and 28; I want to make plots for males and females and for states Pennsylvania and Mississippi.
First, for each variable I need to define a data frame that stores the conversion from number to meaningful category. Fortunately, this information was found in the codebook, and I can copy and paste these code conversions into separate .txt files and save them in the data/ folder: states.txt, occupation_industry.txt, occupation_category.txt, etc. I can then read them into R as tab-delimited text files.
In case you’re interested, after copying the subsets of the codebook, my project directory now looks like this:
data/
  atus_00002.csv.gz
  atus_00002.txt
  education_level.txt
  employment_status.txt
  family_income.txt
  marital_status.txt
  occupation_category.txt
  occupation_industry.txt
  race.txt
  sex.txt
  state.txt
R/
  clean.R
  load.R
I now start work on a convertClass() function which will be the third component of my cleanData() function. The first thing I do in convertClass() is convert the id variable to a factor. I then loop through each of the other factor variables to read in the code conversions from the .txt files, join the meaningful factors onto the original data frame using left_join() and remove the numeric version of the variable. The function that I wrote is presented below. I spent a while playing around in the console with various versions of the function below (always running code from the .R file rather than typing directly in the console itself).
convertClass <- function(data, path_to_codes = "data/") {
  # convert id to a factor
  data <- data %>% mutate(id = as.factor(id))
  # loop through each of the factor variables and convert to meaningful
  # factor then add to data frame
  for (variable in c("state", "occupation_industry", "occupation_category",
                       "education_level", "race", "marital_status", "sex",
                       "employment_status", "family_income")) {
    # identify the path to the code file
    path <- paste0(path_to_codes, variable, ".txt")
    # read in the code file
    codes <- read.table(path, sep = "\t")
    # remove the second column (the entries are separated by two \t's)
    codes <- codes[, -2]
    # convert the column names
    colnames(codes) <- c(variable, paste0(variable, "_name"))
    # add the code to the original data frame
    data <- left_join(data, codes, by = variable)
    # remove old variable and replace with new variable
    data[, variable] <- data[, paste0(variable, "_name")]
    data <- data[, !(colnames(data) %in% paste0(variable, "_name"))]
  }
  return(data)
}
After I was done, I tested out that the convertClass() did what I hoped by running the following code in the console:
# run the convertClass() function
time_use <- convertClass(time_use)
# compare the original variables with the meaningful versions
head(time_use)
id year num_contacts state household_size
1 20160101160045 2016 1 Georgia 3
2 20160101160066 2016 1 Virginia 2
3 20160101160069 2016 2 District of Columbia 4
4 20160101160083 2016 1 Michigan 4
5 20160101160084 2016 1 Missouri 2
6 20160101160094 2016 0 Florida 5
family_income num_children num_adults age sex
1 $7,500 to $9,999 0 3 62 Female
2 $15,000 to $19,999 0 2 69 Male
3 $10,000 to $12,499 2 2 24 Female
4 $25,000 to $29,999 3 1 31 Female
5 $60,000 to $74,999 0 2 59 Female
6 $12,500 to $14,999 4 1 16 Female
race marital_status
1 White only Married - spouse present
2 Black only Married - spouse present
3 Black only Never married
4 White only Divorced
5 White only Married - spouse present
6 American Indian, Alaskan Native Never married
education_level education_years employment_status
1 High school graduate (diploma) 112 <NA>
2 11th grade 111 <NA>
3 High school graduate (GED) 102 <NA>
4 Some college but no degree 214 Full time
5 High school graduate (diploma) 112 Full time
6 10th grade 110 <NA>
occupation_category
1 <NA>
2 <NA>
3 <NA>
4 Healthcare support occupations
5 Education, training, and library occupations
6 <NA>
occupation_industry employed_full_time
1 <NA> NA
2 <NA> NA
3 <NA> NA
4 Health care services, except hospitals 2
5 Educational services 2
6 <NA> NA
hours_usually_worked weekly_earning paid_hourly hourly_wage
1 NA NA NA NA
2 NA NA NA NA
3 NA NA NA NA
4 32 469.44 1 14.67
5 12 302.50 1 17.00
6 NA NA NA NA
hours_worked_hourly_rate time_spent_caring_household
1 NA 0
2 NA 0
3 NA 0
4 32 60
5 NA 0
6 NA 0
time_spent_caring_non_household time_spent_education time_spent_eating
1 0 0 40
2 0 0 30
3 0 0 75
4 0 0 165
5 0 0 30
6 0 0 120
time_spent_gov time_spent_household_activities time_spent_household_services
1 0 190 0
2 0 230 0
3 0 105 0
4 0 395 0
5 0 250 0
6 0 100 0
time_spent_personal_care time_spent_phone time_spent_personal_care_services
1 715 0 0
2 620 0 0
3 1060 0 0
4 655 45 0
5 580 120 0
6 620 0 0
time_spent_shopping time_spent_religion time_spent_leisure time_spent_sports
1 0 0 465 0
2 0 0 560 0
3 60 0 20 0
4 0 0 120 0
5 18 60 177 0
6 0 0 355 50
time_spent_travelling time_spent_volunteer time_spent_working
1 30 0 0
2 0 0 0
3 60 0 0
4 0 0 0
5 75 130 0
6 35 0 0Everything looks good! I add renameColumns(), convertMissing() and convertClass() to the cleanData() function. I’m finally done with the cleaning component of my workflow. I may have to come back and add additional steps as I make unpleasant discoveries in my analysis, but for now, I can move on.
Below I print my final clean.R file
# filename: clean.R

# Main function for data cleaning stage
cleanData <- function(data) {
  # rename each of the columns to be human-readable
  # ignore some of the useless columns (such as alternative ID columns)
  data <- renameColumns(data)
  # convert missing data to NA
  data <- convertMissing(data)
  # convert integers to meaningful factors
  data <- convertClass(data)
  return(data)
}

# rename each of the columns to be human-readable
renameColumns <- function(data) {
  data <- data %>% select(id = CASEID,
                          year = YEAR,
                          # number of attempted contacts
                          num_contacts = NUMCONTACTS_CPS8,
                          state = STATEFIP,
                          household_size = HH_SIZE,
                          family_income = FAMINCOME,
                          num_children = HH_NUMKIDS,
                          num_adults = HH_NUMADULTS,
                          age = AGE,
                          sex = SEX,
                          race = RACE,
                          marital_status = MARST,
                          education_level = EDUC,
                          employment_status = EMPSTAT,
                          occupation_category = OCC2,
                          occupation_industry = IND2,
                          employed_full_time = FULLPART,
                          hours_usually_worked = UHRSWORKT,
                          weekly_earning = EARNWEEK,
                          paid_hourly = PAIDHOUR,
                          hourly_wage = HOURWAGE,
                          hours_worked_hourly_rate = HRSATRATE,
                          time_spent_caring_household = ACT_CAREHH,
                          time_spent_caring_non_household = ACT_CARENHH,
                          time_spent_education = ACT_EDUC,
                          time_spent_eating = ACT_FOOD,
                          time_spent_gov = ACT_GOVSERV,
                          time_spent_household_activities = ACT_HHACT,
                          time_spent_household_services = ACT_HHSERV,
                          time_spent_personal_care = ACT_PCARE,
                          time_spent_phone = ACT_PHONE,
                          time_spent_personal_care_services = ACT_PROFSERV,
                          time_spent_shopping = ACT_PURCH,
                          time_spent_religion = ACT_RELIG,
                          time_spent_leisure = ACT_SOCIAL,
                          time_spent_sports = ACT_SPORTS,
                          time_spent_travelling = ACT_TRAVEL,
                          time_spent_volunteer = ACT_VOL,
                          time_spent_working = ACT_WORK)
  return(data)
}

# identify missing values equal to 99, 999, etc
equalFun <- function(x, value) {
  x == value
}

# identify if the max of a variable is equal to 99, 999, etc
maxFun <- function(x, value) {
  max(x, na.rm = T) == value
}

# convert weird missing values to NA
convertMissing <- function(data) {
  # convert missing values to NA
  data <- data %>%
    # mutate all missing values coded as 99 to NA
    mutate_if(function(x) maxFun(x, 99),
              funs(if_else(equalFun(., 99), NA_integer_, .))) %>%
    # mutate all missing values coded as 999 to NA
    mutate_if(function(x) maxFun(x, 999),
              funs(if_else(equalFun(., 999), NA_integer_, .))) %>%
    # mutate all missing values coded as 9999 to NA
    mutate_if(function(x) maxFun(x, 9999),
              funs(if_else(equalFun(., 9999), NA_integer_, .))) %>%
    # mutate all missing values coded as 999.99 to NA
    mutate_if(function(x) maxFun(x, 999.99),
              funs(if_else(equalFun(., 999.99), NA_real_, .))) %>%
    # mutate all missing values coded as 99999.99 to NA
    mutate_if(function(x) maxFun(x, 99999.99),
              funs(if_else(equalFun(., 99999.99), NA_real_, .))) %>%
    # mutate all missing values coded as 998 to NA
    mutate_if(function(x) maxFun(x, 998),
              funs(if_else(equalFun(., 998), NA_integer_, .))) %>%
    # mutate all missing values coded as 997 to NA
    mutate_if(function(x) maxFun(x, 997),
              funs(if_else(equalFun(., 997), NA_integer_, .))) %>%
    # mutate all missing values coded as 9995 to NA
    mutate_if(function(x) maxFun(x, 9995),
              funs(if_else(equalFun(., 9995), NA_integer_, .)))
  return(data)
}

# change numerics to meaningful factors
convertClass <- function(data, path_to_codes = "data/") {
  # convert id to a factor
  data <- data %>% mutate(id = as.factor(id))
  # loop through each of the factor variables
  for (variable in c("state", "occupation_industry", "occupation_category",
                       "education_level", "race", "marital_status", "sex",
                       "employment_status", "family_income")) {
    # identify the path to the code file
    path <- paste0(path_to_codes, variable, ".txt")
    # read in the code file
    codes <- read.table(path, sep = "\t")
    # remove the second column (the entries are separated by two \t's)
    codes <- codes[, -2]
    # convert the column names
    colnames(codes) <- c(variable, paste0(variable, "_name"))
    # add the code to the original data frame
    data <- left_join(data, codes, by = variable)
    # remove old variable and replace with new variable
    data[, variable] <- data[, paste0(variable, "_name")]
    data <- data[, !(colnames(data) %in% paste0(variable, "_name"))]
  }
  return(data)
}
Analysis: eda.Rmd
Where I go from here depends strongly on what questions I want to ask. If I already know the category of questions I’m planning to ask, and, for example, I know that they fall into two groups, then I will probably make two .Rmd files, one for each question.
If, however, I just want to play around with the data for a while, as is the case here, I will make a .Rmd file called eda.Rmd (or something along those lines).
Sometimes I end up separating my initial exploration file into several separate files when I start to go down several diverging paths.
Regardless of the analysis I decide to conduct, each of my .Rmd files will start with the following code:
library(tidyverse)
source("R/load.R")
source("R/clean.R")

# laod the data
time_use_orig <- loadData()
# clean the data
time_use <- cleanData(time_use_orig)
The opportunities for analysis are wide open!
List of variables downloaded from ATUX-X
- CASEID (ATUS Case ID)
- YEAR (Survey year)
- NUMCONTACTS_CPS8 (Number of actual and attempted personal contacts)
- HRHHID_CPS8 (Household ID (CPS))
- HRHHID2_CPS8 (Household ID part 2 (CPS))
- STATEFIP (FIPS State Code)
- HH_SIZE (Number of people in household)
- FAMINCOME (Family income)
- HH_NUMKIDS (Number of children under 18 in household)
- HH_NUMADULTS (Number of adults in household)
- PERNUM (Person number (general))
- LINENO (Person line number)
- WT06 (Person weight, 2006 methodology)
- AGE (Age)
- SEX (Sex)
- RACE (Race)
- HISPAN (Hispanic origin)
- ASIAN (Asian origin)
- MARST (Marital status)
- AGE_CPS8 (Age (CPS))
- SEX_CPS8 (Sex (CPS))
- EDUC (Highest level of school completed)
- EDUCYRS (Years of education)
- SCHLCOLL (Enrollment in school or college)
- SCHLCOLL_CPS8 (Enrollment in school or college (CPS))
- EMPSTAT (Labor force status)
- OCC2 (General occupation category, main job)
- OCC (Detailed occupation category, main job)
- IND2 (General industry classification, main job)
- IND (Detailed industry classification, main job)
- FULLPART (Full time/part time employment status)
- UHRSWORKT (Hours usually worked per week)
- UHRSWORK1 (Hours usually worked per week at main job)
- UHRSWORK2 (Hours usually worked per week at other jobs)
- EARNWEEK (Weekly earnings)
- PAIDHOUR (Hourly or non-hourly pay)
- EARNRPT (Easiest way to report earnings)
- HOURWAGE (Hourly earnings)
- HRSATRATE (Hours worked at hourly rate)
- OTUSUAL (Usually receives overtime, tips, commission at main job)
- OTPAY (Weekly overtime earnings)
- UHRSWORKT_CPS8 (Hours usually worked per week (CPS))
- UHRSWORK1_CPS8 (Hours usually worked per week at main job (CPS))
- UHRSWORK2_CPS8 (Hours usually worked per week at other jobs (CPS))
- HRSWORKT_CPS8 (Hours worked last week (CPS))
- ACT_CAREHH (ACT: Caring for and helping household members)
- ACT_CARENHH (ACT: Caring for and helping non-household members)
- ACT_EDUC (ACT: Educational activities)
- ACT_FOOD (ACT: Eat and drinking)
- ACT_GOVSERV (ACT: Government services and civic obligations)
- ACT_HHACT (ACT: Household activities)
- ACT_HHSERV (ACT: Household services)
- ACT_PCARE (ACT: Personal care)
- ACT_PHONE (ACT: Telephone calls)
- ACT_PROFSERV (ACT: Professional and personal care services)
- ACT_PURCH (ACT: Consumer purchases)
- ACT_RELIG (ACT: Religious and spiritual activities)
- ACT_SOCIAL (ACT: Socializing, relaxing, and leisure)
- ACT_SPORTS (ACT: Sports, exercise, and recreation)
- ACT_TRAVEL (ACT: Traveling)
- ACT_VOL (ACT: Volunteer activities)
- ACT_WORK (ACT: Working and Work-related Activities)
- ERS_ASSOC (ERS: Activities associated with primary eating and drinking (travel and waiting))
- ERS_PRIM (ERS: Primary eating and drinking)